DATE2021.05.07 #Press Releases
Discovering galaxies playing "hide-and-seek".
Disclaimer: machine translated by DeepL which may contain errors.
Rieko Momose (JSPS Research Fellow, Academic Support Staff)
Kazuhiro SHIMASAKU (Associate Professor, Department of Astronomy)
Kentaro Nagamine, Professor, Osaka University
Kazuhiro Shimizu, Associate Professor, Shikoku Gakuin University
Key points of the presentation
- We found that certain distant galaxies may be visible or invisible depending on the direction from which they are observed.
- This is the first time that galaxies with such a behavior have been known.
- The presentation drew attention to the search for large-scale structure in the distant Universe using galaxies (Note 1), and deepened our understanding of the relationship between galaxies, large-scale structure, and intergalactic gas.
Summary of Presentation
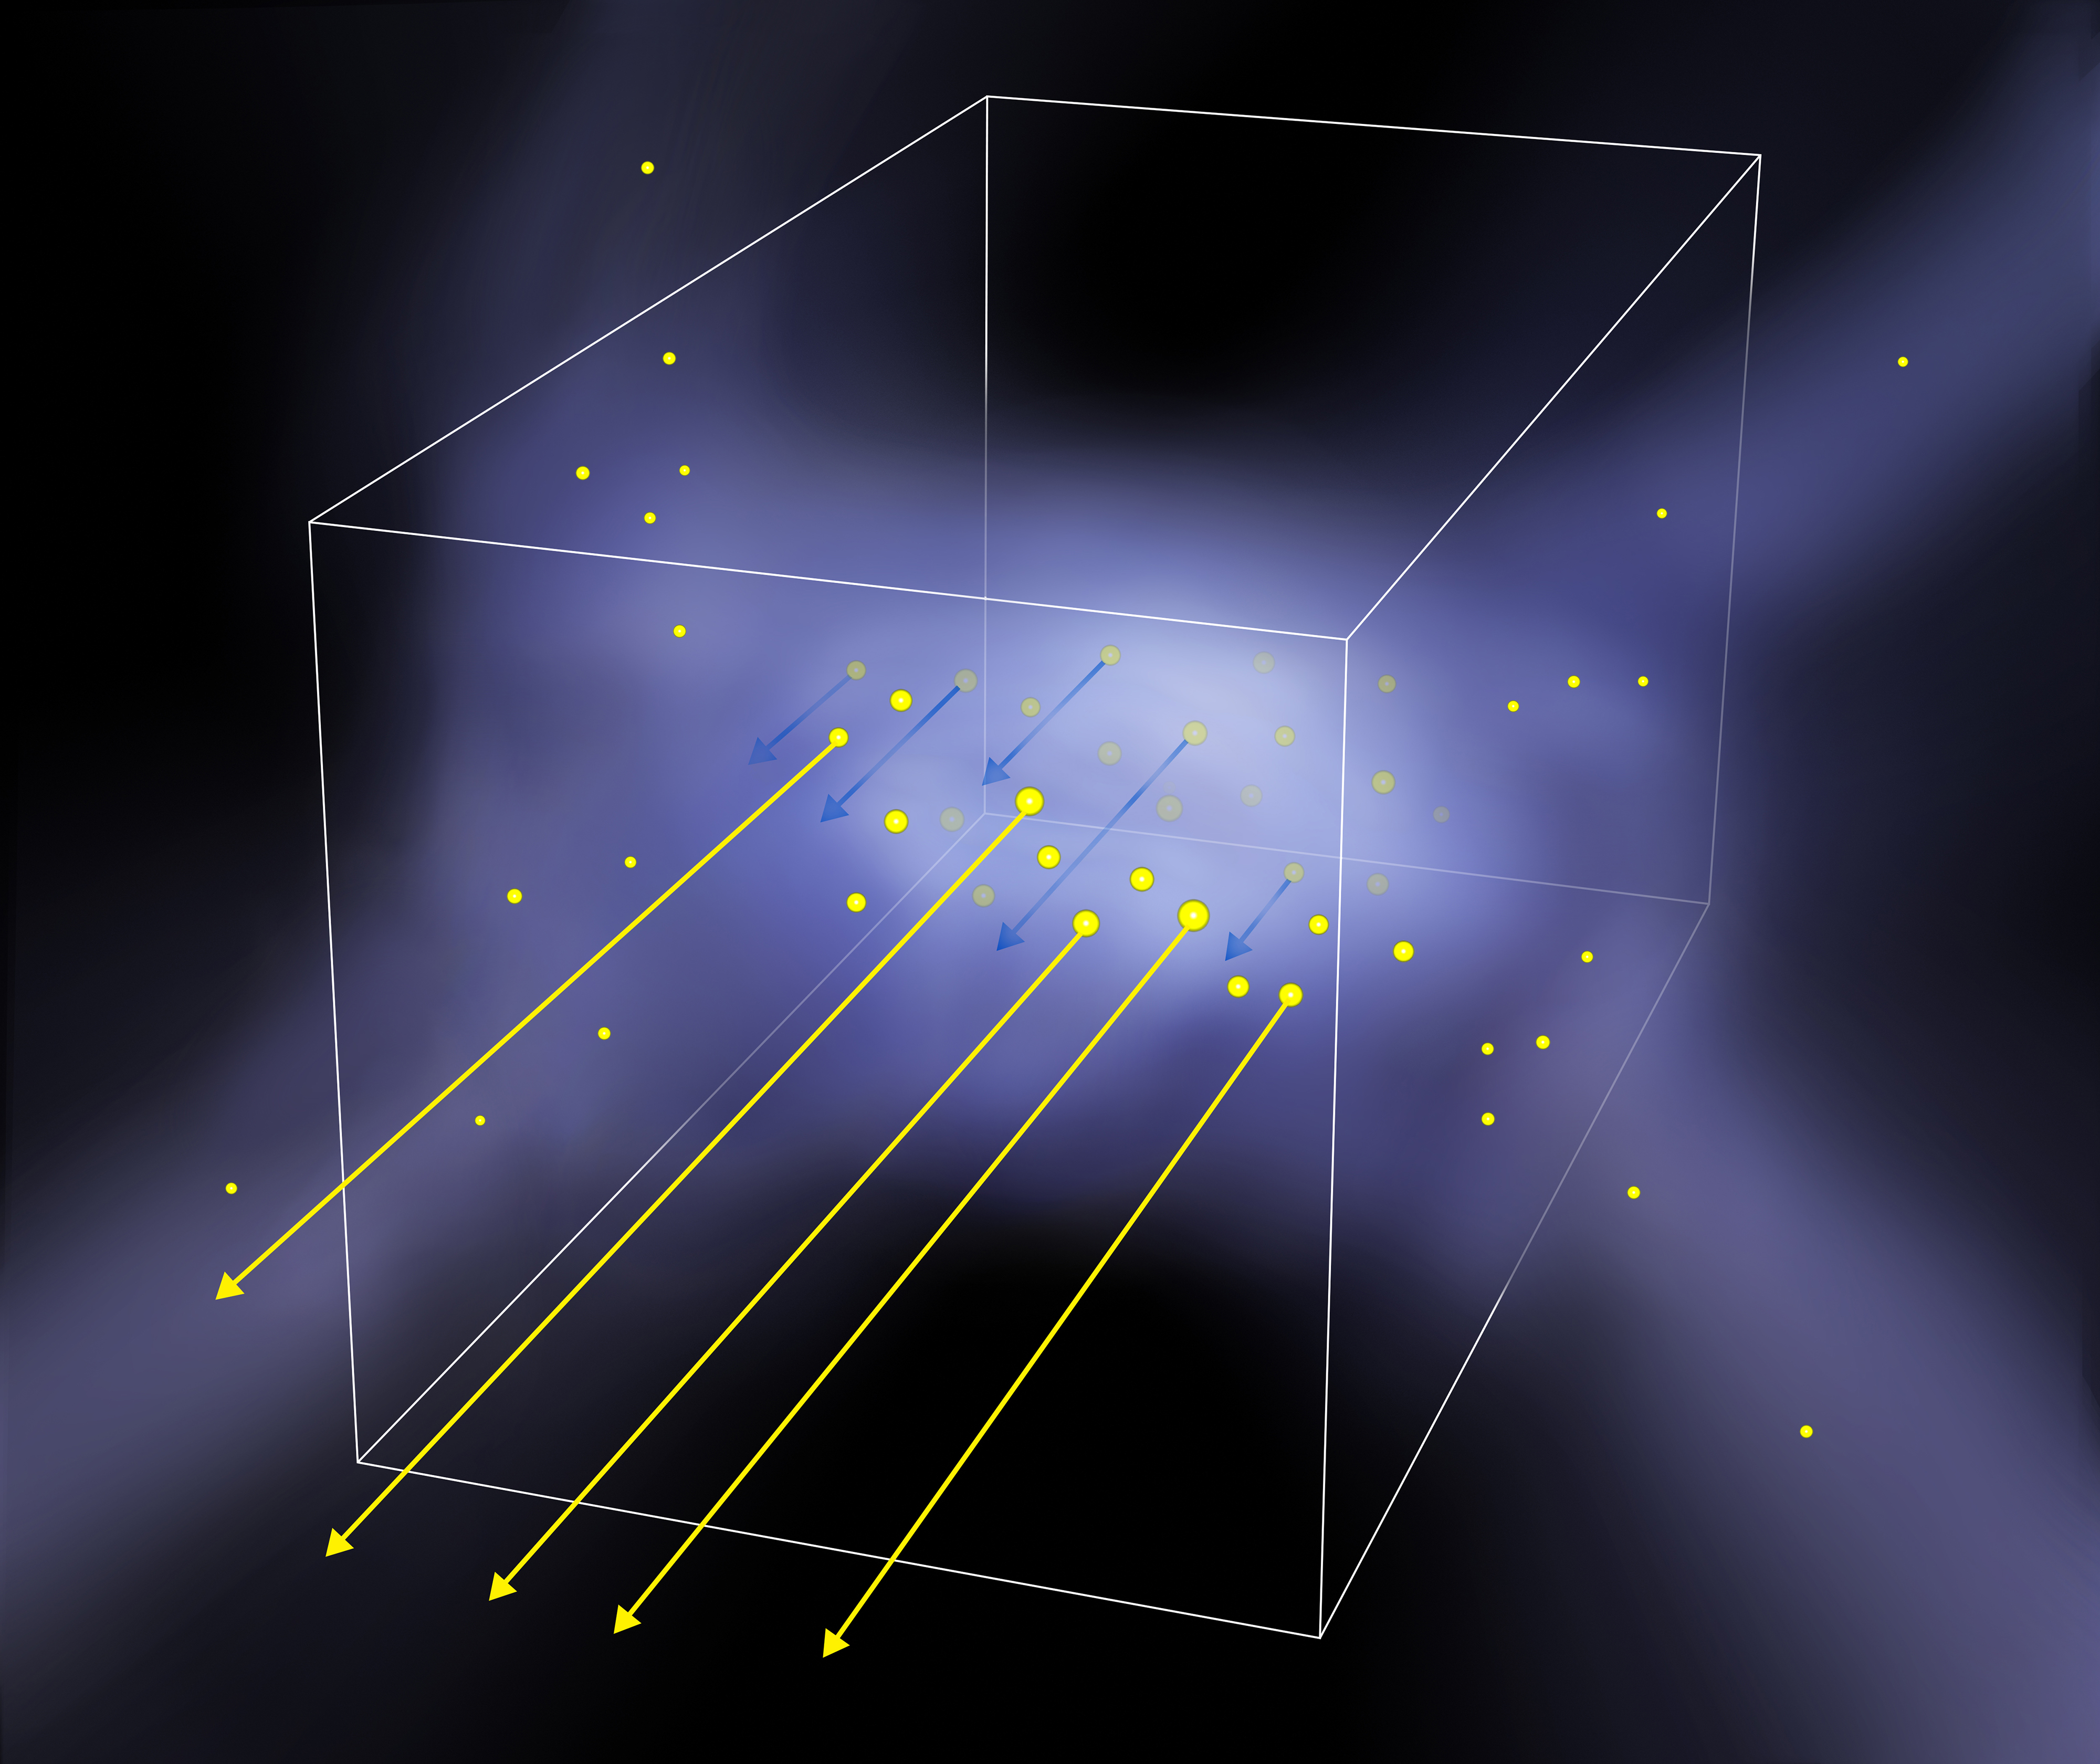
Galaxies brightened by the Lyman-alpha emission lines (Note 2) of hydrogen atoms are often used to search for large-scale structure in the distant Universe. A research team led by Rieko Momose, JSPS Research Fellow at the Graduate School of Science, The University of Tokyo, Associate Professor Kazuhiro Shimasaku, Professor Kentaro Nagamine at the Graduate School of Science, Osaka University, and Associate Professor Kazuhiro Shimizu at Shikoku Gakuin University has used observation data of neutral hydrogen gas (intergalactic gas) (Note 3) filling space 11 billion years ago (Note 3), they discovered that this type of galaxy does not properly trace the large-scale structure of the universe. Furthermore, they pointed out the possibility that this type of galaxy is hidden from view in regions of dense intergalactic gas, as if it were playing hide-and-seek (Figure 1). This study has called attention to the study of the large-scale structure of the distant Universe, and has revealed once again that there are still interesting phenomena hidden in the distant Universe.

Figure 1: An image of the appearance of galaxies and intergalactic gas revealed by this study. The galaxies in the dense intergalactic gas region are hidden by the gas from the observer in the lower left.
Presentation
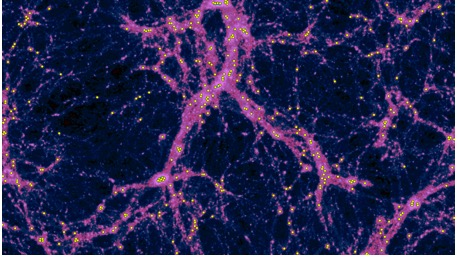
The largest structure in the universe is large-scale structure composed of dark matter, which is matter that cannot be directly observed (Figure 2). In the early universe, the distribution of dark matter was slightly uneven. Later, due to gravitational interaction, this "density irregularity" grows to higher densities in high-density areas, and to lower densities in low-density areas, eventually forming a thread-like structure like a spider's web. This is the large-scale structure of dark matter. Galaxies such as our own Milky Way Galaxy are thought to form and evolve within the filaments of this large-scale structure. Therefore, large-scale structures and galaxies are deeply related, and it is crucial to elucidate the relationship between them.

Figure 2: Large-scale structure of dark matter. The density of dark matter is higher in the purple areas and lower in the dark blue areas. Intergalactic gas is distributed in densities similar to the large-scale structure of dark matter. Galaxies are represented by yellow circles.
The large-scale structure of dark matter is not directly "visible" but can be inferred from the distribution of "visible" galaxies (Figure 2). In the distant Universe (the Universe when it was much younger than it is today), galaxies that are brightened by the Lyman-alpha emission lines of hydrogen atoms (Lyman-alpha galaxies) have been used as observational indicators of large-scale structure. Recently, however, it has been reported that the large-scale structure depicted by Lyman-alpha galaxies is different from that of other types of galaxies. This raises the question, "Are Lyman-alpha galaxies not correctly tracing the large-scale structure?" If so, the question arises, "Why can't Lyman-alpha galaxies trace the large-scale structure correctly? If this is the case, why can't Lyman Alpha galaxies be traced correctly? In this study, we addressed this question using data from observations of intergalactic neutral hydrogen gas, which is an observational indicator of large-scale structure that is different from galaxies.
The distribution of intergalactic gas around a galaxy can be used to determine whether the galaxy is correctly tracing the large-scale structure. Individual galaxies may happen to have thin gas in one direction and thick gas in another direction. However, when averaged over a large number of galaxies, these variations are smoothed out, so if a galaxy is correctly tracing the large-scale structure, the gas distribution should be the same in all directions from the galaxy. On the other hand, if there is some bias, the gas distribution may be different in different directions. Let us compare this idea to the relationship between a station and a residential area. In this case, the station corresponds to the galaxy. The residential area around a station (= intergalactic gas) may vary from north at one station to both east and west at another station, but if we collect data from many stations and average them, the extent of the residential area is independent of the direction. However, if stations with residential areas spreading to the north are collected preferentially, the result will naturally be that residential areas are biased toward the north. The idea regarding the gas distribution around the galaxy is the same as this.
In this study, we obtained the gas distribution around Lyman-Alpha galaxies in the universe 11 billion years ago in three different directions and examined whether the gas distribution differs depending on the orientation (Figure 3). In addition to Lyman-Alpha galaxies, we also examined the gas distribution around two other galaxy types, continuous-light galaxies and visible emission-line galaxies (Note 4), which are believed to correctly trace the large-scale structure, and compared the results with those of Lyman-Alpha galaxies.

Figure 3: Diagram of the analysis method used in this study. As shown in the figure, the intergalactic gas distribution is obtained for the line-of-sight direction by dividing it into the front side and the back side, for the two directions perpendicular to the line-of-sight direction by dividing the east-west direction into the east and west side, and for the north-south direction by dividing it into the south and north side. The telescope represents the observer's position.
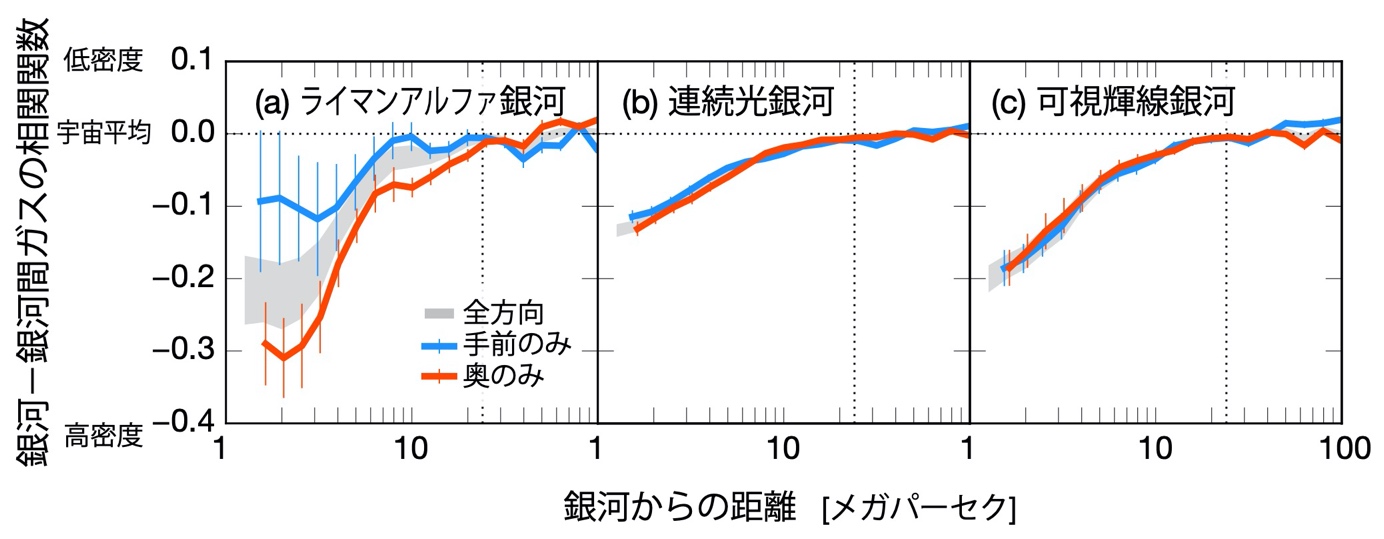
The obtained gas distribution shows that the density of intergalactic gas around the galaxies decreases uniformly with distance from the galaxy in all directions for both continuous-light and visible emission-line galaxies. For Lyman-Alpha galaxies, the same result was obtained for the direction perpendicular to the line of sight. However, for the Lyman-alpha galaxy in the line-of-sight direction, the gas density in front of the galaxy is on average lower, while the gas density at the back of the galaxy is higher (Figure 4). This result suggests that continuous-light and visible emission-line galaxies follow the density distribution of intergalactic gas, while Lyman-alpha galaxies are mainly located in the foreground of the high-density region of intergalactic gas.

Figure 4: Galaxy-intergalactic gas correlation measured separately on the front side (our side) and on the back side of the galaxy (Figure 3-1). This correlation function corresponds to the density distribution of intergalactic gas around the galaxy. Negative values and larger absolute values indicate a higher density of intergalactic gas. a) shows the results for Lyman-alpha galaxies, b) for continuous-light galaxies, and c) for visible emission-line galaxies. The red and blue lines almost overlap in the continuous-light and visible emission-line galaxies. This result indicates that the density distribution of intergalactic gas is almost the same between the front and back sides of these galaxies. On the other hand, in the Lyman-Alpha galaxy in a), the red and blue lines do not overlap, and the blue line is located at about 20 megaparsecs above the red line. This suggests that in Lyman-Alpha galaxies, the intergalactic gas in the foreground is less dense than the gas in the background.
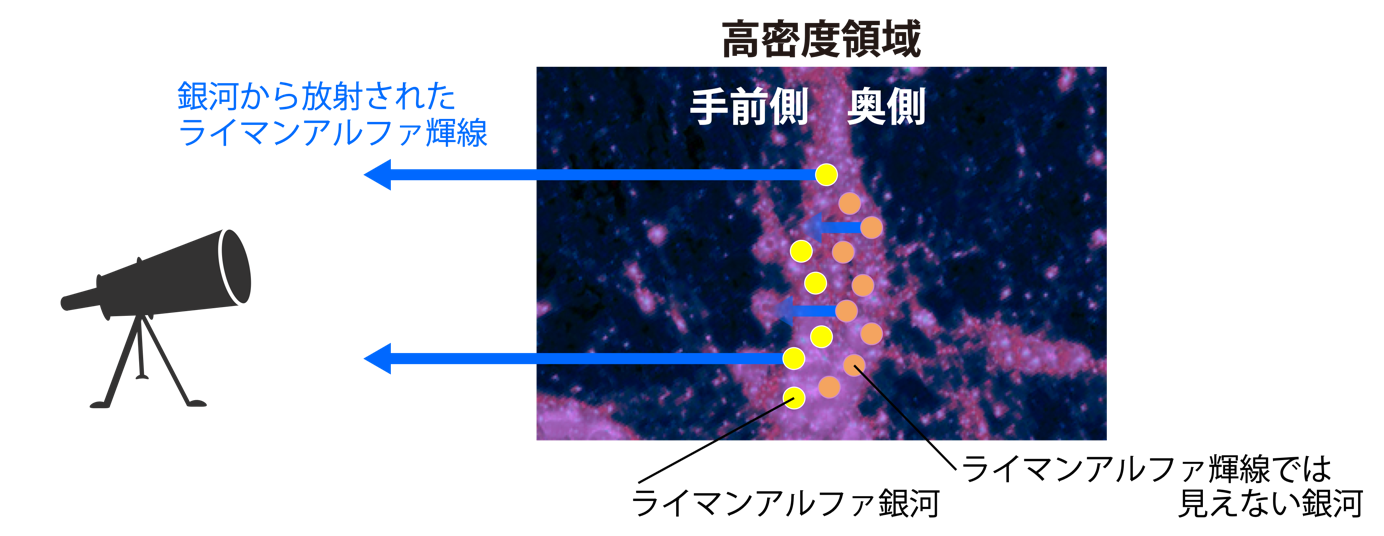
However, since the line-of-sight direction is determined by us as observers and has no special meaning for Lyman-alpha galaxies, it is difficult to imagine a situation in which the intergalactic gas is really distributed more toward the front of the high-density region of the intergalactic gas. In fact, we believe that this biased distribution is only apparent. Lyman-alpha emission lines are absorbed and scattered by neutral hydrogen gas. Therefore, it is expected that Lyman alpha emission lines emitted from galaxies in the high-density region or from galaxies located behind the high-density region will be absorbed by the intergalactic gas in the foreground, making them less likely to be observed. This is similar to the phenomenon in which fog (intergalactic gas) obscures the headlights of oncoming cars (Lyman-alpha galaxies). On the other hand, Lyman-alpha emission lines from galaxies in front of the high-density region are not absorbed by the intergalactic gas and reach us. As a result, Lyman-alpha galaxies do not appear to be associated with high-density regions. We have shown that this idea is correct by performing quasi-observations of visible emission line galaxies as if they were Lyman-alpha galaxies. In other words, galaxies bright in the Lyman-Alpha emission lines are distributed along the large-scale structure of intergalactic gas and dark matter, but those in the high-density regions and behind them are obscured by the intergalactic gas in the foreground (Fig. 5). It is as if the galaxies are playing "hide-and-seek" in the intergalactic gas. If we were to look at the observed region from a different direction, some Lyman Alpha galaxies would be obscured while others would be visible.

Figure 5: Schematic diagram of high-density regions of intergalactic gas and distribution of galaxies suggested by the results of this study. Galaxies visible in Lyman-alpha emission lines (Lyman-alpha galaxies) are shown in yellow, and invisible galaxies are shown in orange. The blue arrows are Lyman-alpha emission lines emitted from galaxies. The Lyman-Alpha emission lines from Lyman-Alpha galaxies reach us, while those from invisible galaxies are absorbed by the intergalactic gas in front of them and do not reach us. Galaxies further out in the high-density region (including galaxies beyond the right frame of the figure) become visible again. The Lyman-alpha emission lines from these galaxies are red-shifted to a wavelength sufficiently longer than the original wavelength by the time they reach the high-density region, so they are not absorbed by the galaxies. The key point of this study is that only galaxies inside or immediately behind the high-density region become invisible.
This result indicates that Lyman-alpha galaxies may not correctly reflect the large-scale structure of dark matter. We also found that the reason for this is the nature of Lyman-alpha emission lines. This is an important result that calls for caution in studies that search for large-scale structure and high-density regions in the distant universe.
Galaxies emit a variety of emission lines. Many of the emission lines in distant galaxies are redshifted to wavelengths that cannot be observed with ground-based telescopes (Note 5), but the Lyman-Alpha emission lines allow ground-based telescopes to search for galaxies at wide redshifts in the universe. For this reason, Lyman-alpha galaxies have been useful in searching for large-scale structure in the distant Universe. However, this study reveals that the convenient and frequently used emission line galaxies may actually not faithfully reflect the distribution of intergalactic gas and dark matter matter, which are affected by the surrounding wide-area gas.
Research on the relationship between galaxies and intergalactic gas, such as this study, is a developing field and there are still many unknowns. For this reason, it is one of the major research themes in the wide-area exploration program of the Prime Focus Spectrograph (PFS) (Note 6), an ultra-wide-field multi-object spectrograph being conducted by an international team led by the Kavli Institute for the Physics and Mathematics of the Universe (Kavli IPMU) of The University of Tokyo Institutes for Advanced Study. We will continue to combine observational and theoretical data for further research.
This study is based on intergalactic gas data from the COSMOS Lyman-Alpha Mapping And Tomography Observations survey (CLAMATO; Lee et al. 2016, 2018 ) and published galaxy catalogs (see Momoseet al. 2021, see ApJ, 909, 117 ). This research was also supported by a JSPS Research Fellowship (Assignment No. 18J40088) and a Grant-in-Aid for Scientific Research (A) "Toward a Theory of Fine Structure Formation: Distribution of Baryons, Metals, and Dust in the Universe" (Assignment No. 17H01111, PI: Kentaro Nagamine) from the Japan Society for the Promotion of Science (JSPS). Kentaro Nagamine, Principal Investigator of the project).
Journal
-
Journal name The Astrophysical Journal Letters Title of paper Catch me if you can: Biased distribution of Lyα-emitting galaxies according to the viewing directionAuthor(s) Rieko Momose*, Kazuhiro Shimasaku, Kentaro Nagamine, Ikkoh Shimizu, Nobunari Kashikawa, Makoto Ando, Haruka KusakabeDOI number 10.3847/2041-8213/abf04c URL
Terminology
Note 1: Large-scale structure
In space, dark matter has a structure in which the densely populated areas are thread-like, like a spider's web. This structure is called large-scale structure. ↑up
Note 2 Lyman alpha emission lines
Lyman alpha emission lines are bright light at a specific wavelength originating from hydrogen atoms. More specifically, the Lyman alpha emission line is the ultraviolet light with a wavelength of 121.6 nanometers emitted when an electron transitions from the quantum number n=2 to the n=1 level in a hydrogen atom. The Lyman-alpha emission line is thought to be strongly emitted by young galaxies with active star formation, and is often used as an observational indicator of galaxies in the distant universe. ↑up
Note 3 Neutral hydrogen gas
Of the elements in the universe, about 74% by mass is hydrogen. Hydrogen is generally composed of a proton in the nucleus and an electron orbiting it. This state is called the "neutral state" or "neutral hydrogen atom. Neutral hydrogen gas is a gas composed of neutral hydrogen atoms. ↑up
Note 4 Continuous-light galaxies and visible emission-line galaxies
The spectrum of a galaxy consists of continuous light, which shines evenly at any wavelength, and emission lines, which shine only at specific wavelengths. In this study, galaxies that appear bright in continuous light are called "continuous-light galaxies," while galaxies that appear bright in emission lines (green visible light ) around 500 nanometers emitted from ionized oxygen are called "visible emission-line galaxies" ( to distinguish them from Lyman-alpha galaxies, which are also a type of emission-line galaxy ). Like Lyman-alpha galaxies, both continuous-light galaxies and visible emission-line galaxies were commonplace in the universe at the time. However, these galaxies are not good at depicting the large-scale structure of the distant universe due to observational conditions and data limitations. ↑up
Note 5 Redshift
Redshift is a phenomenon in which the wavelength of light emitted from objects in the distant Universe is observed to be extended. There are several causes of redshift, but in the case of galaxies in the distant universe, the cause is the expansion of the universe. The effect of the expansion of the universe stretches the space through which light travels, which in turn stretches the wavelength of the light. ↑up
Note 6: Ultra-wide-field multi-object spectrograph PFS
The PFS is one of the next-generation instruments scheduled to be installed on the Japanese Subaru Telescope in Hawaii. The PFS is currently under construction in an international collaboration led by the Kavli Institute for the Physics and Mathematics of the Universe (Kavli IPMU) at The University of Tokyo Institute for Advanced Study, with a target year of 2022 for scientific operation. ↑up


