
DATE2021.06.20 #Press Releases
High resolution imaging of "anisotropic" structures by seismic waveform analysis
Disclaimer: machine translated by DeepL which may contain errors.
〜Visualization of Convection Currents at the Deepest Part of the Earth's Mantle
Kenshi Kawai, Associate Professor, Department of Earth and Planetary Science
Geller, Robert (Emeritus Professor, The University of Tokyo)
Hiroki Suzuki (Researcher, Tokyo Institute of Technology / Visiting Researcher, Graduate School of Science)
Key points of the presentation
- We have succeeded in estimating the "anisotropic" structure of 3D seismic wave velocity at the deepest part of the mantle under the northern Pacific Ocean with the world's highest resolution by developing a seismic wave analysis method that we have been independently developing. As a result, we were able to visualize the convective motions occurring at the bottom of the mantle today, including the folding and induced upwelling of subducting oceanic plates.
- Although it had been suggested that oceanic plates were subducting into the Earth's deep interior, their fate and impact had remained a mystery. The present results show that the oceanic plate, which was subducted from the surface about 200 million years ago, reaches the deepest part of the mantle and folds, triggering an upwelling consisting of warm material that has been pushed away.
- The seismic "anisotropic" structure obtained in this study suggests that the surface plate motion affects the motion of the deepest part of the mantle at a depth of 2900 km. It is hoped that the methods developed in this study will reveal more details about the flow in the Earth's interior and advance our understanding of the Earth's evolution.
Summary of Presentation
Visiting Associate Professor Kenshi Kawai, Emeritus Professor Robert Geller, and Visiting Professor Hiroki Suzuki of the Graduate School of Science, The University of Tokyo, have developed a seismic wave analysis method called the "waveform inversion method" (Note 1), and analyzed the horizontal2 The results of this analysis showed that the mantle under the northern Pacific Ocean was a major source of seismic activity. As a result, we succeeded in estimating the 3D seismic "anisotropic" structure (Note 4) with the world's highest resolution (about 100 times ( =53 times ) the resolution of existing 3D structure estimation models) for the deepest (Note 3) region of the mantle under the northern Pacific Ocean. Contrasting this with high-pressure experiments and the latest findings in mineral physics, it is clear that the oceanic plate (Note 5), which was subducted from the surface about 200 million years ago, reached the deepest part of the mantle and folded, triggering an upwelling consisting of warm material that was pushed away. The seismic "anisotropic" structure obtained in this study suggests that plate motions at the Earth's surface affect convective motion at the deepest part of the mantle at a depth of 2900 km. It is hoped that the methods developed in this study will reveal more details about the flow and deformation of the Earth's interior and advance our understanding of the Earth's evolution.
Announcement
With the recent deployment of the large-scale tight-lattice array observation network USArray, which provides high-quality and enormous amount of observational seismic waveform data, it is expected that a better understanding of the Earth's dynamics will be achieved through higher resolution of the inferred structure of the Earth's interior. In particular, the northern Pacific Ocean is an area where geological and geophysical records clearly indicate that oceanic plates have been subducting for hundreds of millions of years, and where a large horizontal area can be surveyed due to the location of epicenters and observation points (Figure 1). Therefore, it is one of the most suitable areas to study for the purpose of investigating the path of subducting oceanic plates.
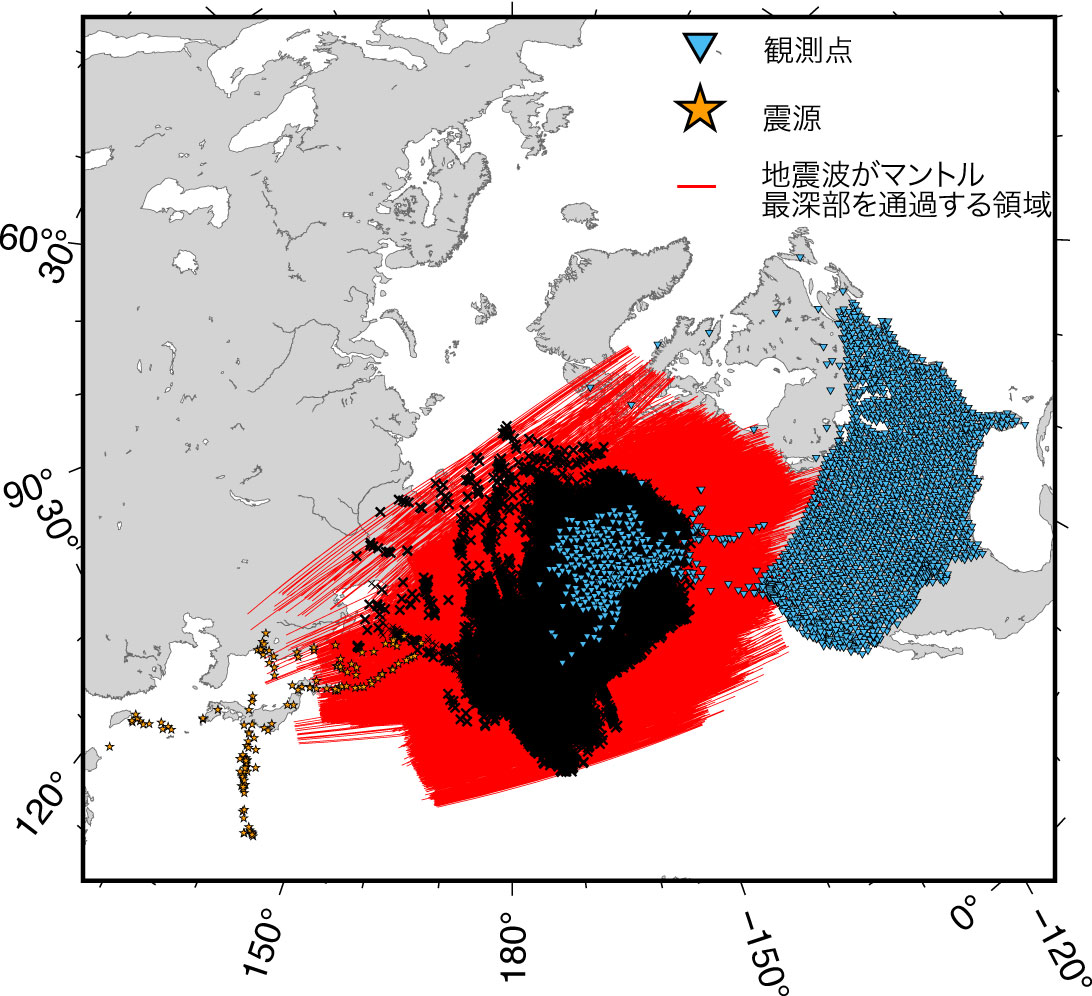
Figure 1: Distribution of epicenters (near Japan) and stations (in North America and Alaska). The red line indicates the extent of the seismic wave propagation path that extends 400 km into the deepest part of the mantle. Black crosses indicate locations of reflections at the core-mantle boundary.
To understand the deformation and flow of subducting oceanic plates, it is necessary to estimate the seismic "anisotropic" structure with a vertical resolution of at least 100 km or less, but existing seismic tomography methods cover the entire globe and therefore have a vertical resolution of ~500 km or so. On the other hand, previous studies that estimated regional seismic "anisotropic" structures at the deepest part of the mantle using differences in arrival times due to differences in S-wave deflection directions were sunk compared to results from high-pressure experiments because of the strong assumptions used (wave-line approximation, incidence angle independence, etc.) and because the differences in arrival times are integral values on the wave-line. It was difficult to discuss the deformation and flow of the subducting plate in comparison with the results of high-pressure experiments. Therefore, in order to quantitatively and objectively estimate the seismic "anisotropic" structure at the deepest part of the mantle, a seismic wave analysis method was needed that could handle huge waveform records such as USArray and use physical property values (elastic constants and density) as estimated parameters that could be contrasted with the results of high-pressure experiments.
The research group has independently developed a "waveform inversion method" that utilizes all the information in the observed waveforms to estimate the structure. This method can also objectively and quantitatively estimate elastic constants directly as estimation parameters, taking into account the incident angle dependence. Recently, the method was successfully applied to the horizontal one component of seismic waves observed at USArray to estimate the high-resolution 3D S-wave velocity structure of the deepest mantle and mantle transition zone (Suzuki + 2016 EPS; Borgeaud+ 2017 Science Adv.; Borgeaud + 2019 JGR). On the other hand, to estimate the seismic "anisotropic" structure, it was necessary to develop a method to analyze the two horizontal components of the observed seismic waveform and estimate two parameters (two elastic constants related to S-wave velocity) simultaneously. Therefore, we improved the analysis method and extended it so that multiple parameters can be estimated simultaneously by analyzing seismic waveforms with multiple components. We then applied the method to the two-component horizontal seismic waveforms observed at USArray, and succeeded in estimating the 3D seismic "anisotropic" structure of the deepest part of the northern sub-Pacific mantle at the world's highest resolution (450 km horizontal and 100 km vertical) (Figure 2).
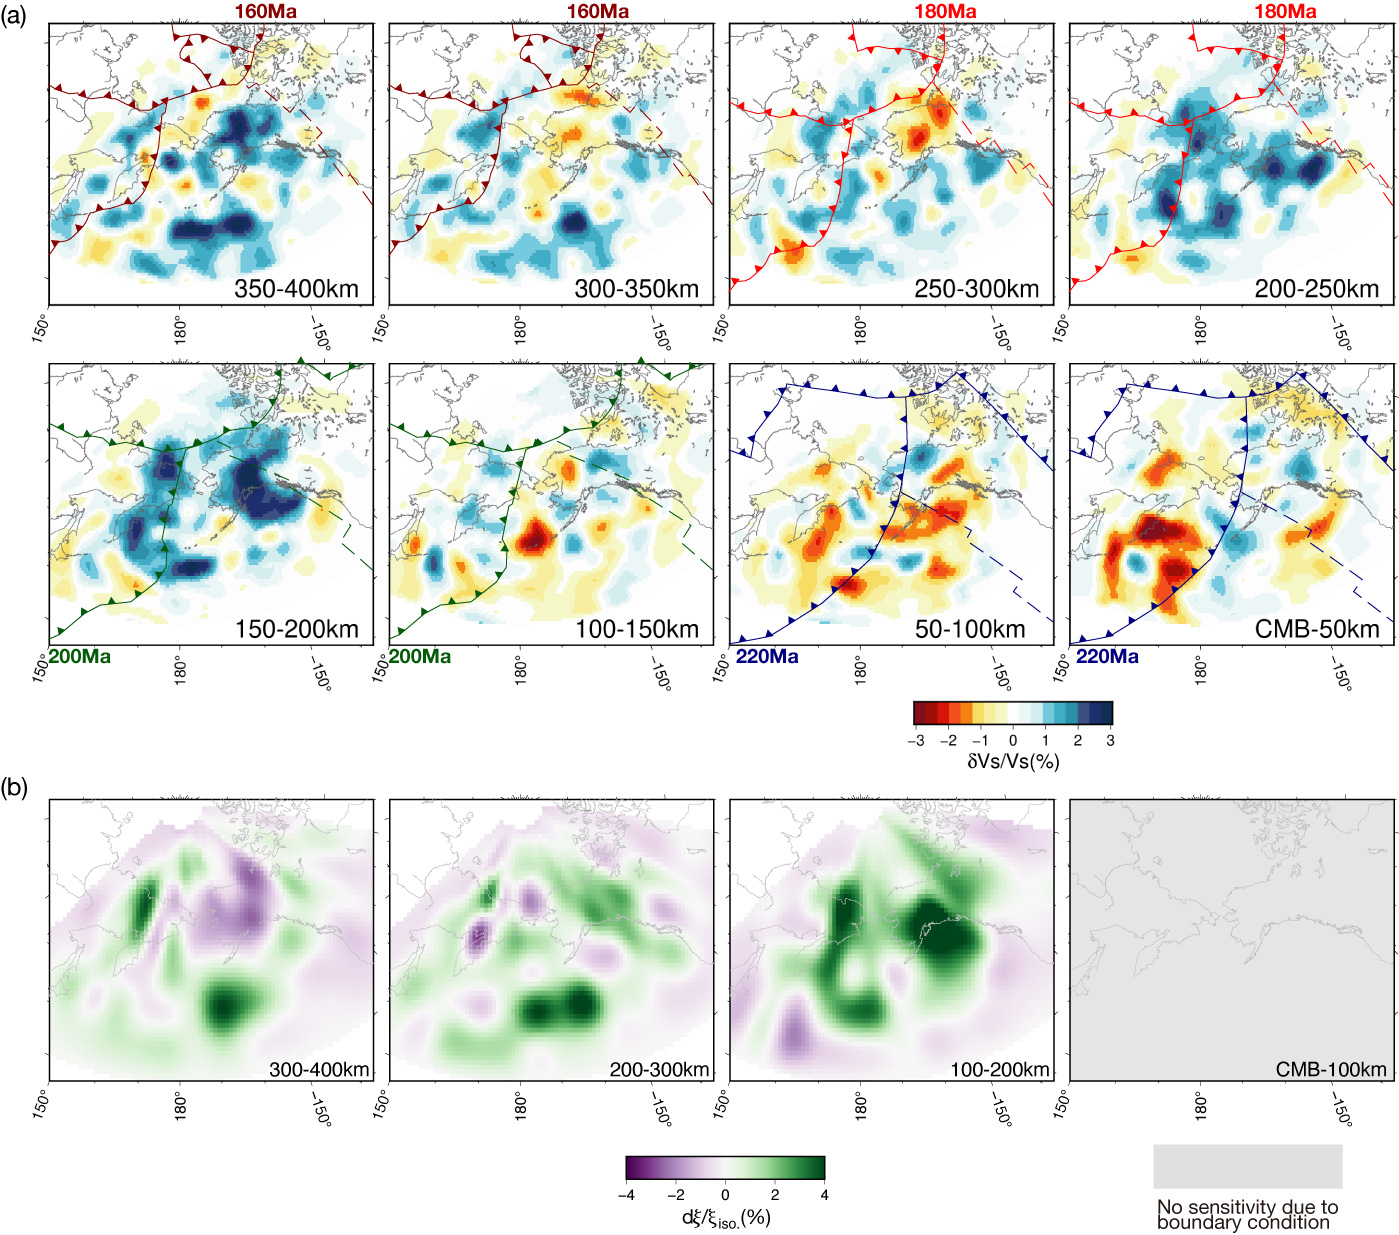
Figure 2: 3D seismic "anisotropic" structure obtained in this study. (a) S-wave velocity structure, showing high velocity anomalies (blue) and low velocity anomalies (red) relative to the average velocity at that depth; the S-wave velocity structure is generally considered to have a high velocity region with a (lower than average) temperature and a low velocity region with a (higher than average) temperature. The overlaid saw-tooth line indicates the location of oceanic plate subduction at the surface about 200 million years ago, as estimated by a reconstruction model of past plate motions. (b) Seismic "anisotropic" structure (the degree of deviation from isotropy is indicated by the color intensity). Based on the slip systems of the constituent minerals of the mantle determined by high-temperature and high-pressure experiments and the elastic properties derived from first-principles calculations, the green region can be interpreted as horizontal flow and the purple region as vertical flow.
The obtained 3D seismic "anisotropic" structure is interpreted based on the slip system (slip surface and direction) and elastic constants of mantle constituent minerals proposed by high-pressure experiments and first-principles calculations to estimate the flow direction of material at the deepest part of the mantle. The results of the flow direction and S-wave velocity structure estimation indicate that the oceanic plate subducted from the surface about 200 million years ago reached the deepest part of the mantle and bent, triggering an upwelling consisting of warm material that was pushed away (Figure 3). In addition, the region of positive "anisotropic" anomaly becomes wider and more severe as it approaches the core-mantle boundary. This result is consistent with rock rheology, which suggests that when a subducting oceanic plate reaches the deepest part of the mantle, strong differential stresses cause the plate to bend and develop "anisotropy" at the bottom of the plate. The seismic velocity structure obtained in this study suggests that plate motion at the surface influences convective motion at the deepest part of the mantle at a depth of 2900 km. It is expected that the method developed in this study will reveal details of the flow and deformation of the Earth's interior and advance our understanding of the Earth's evolution.
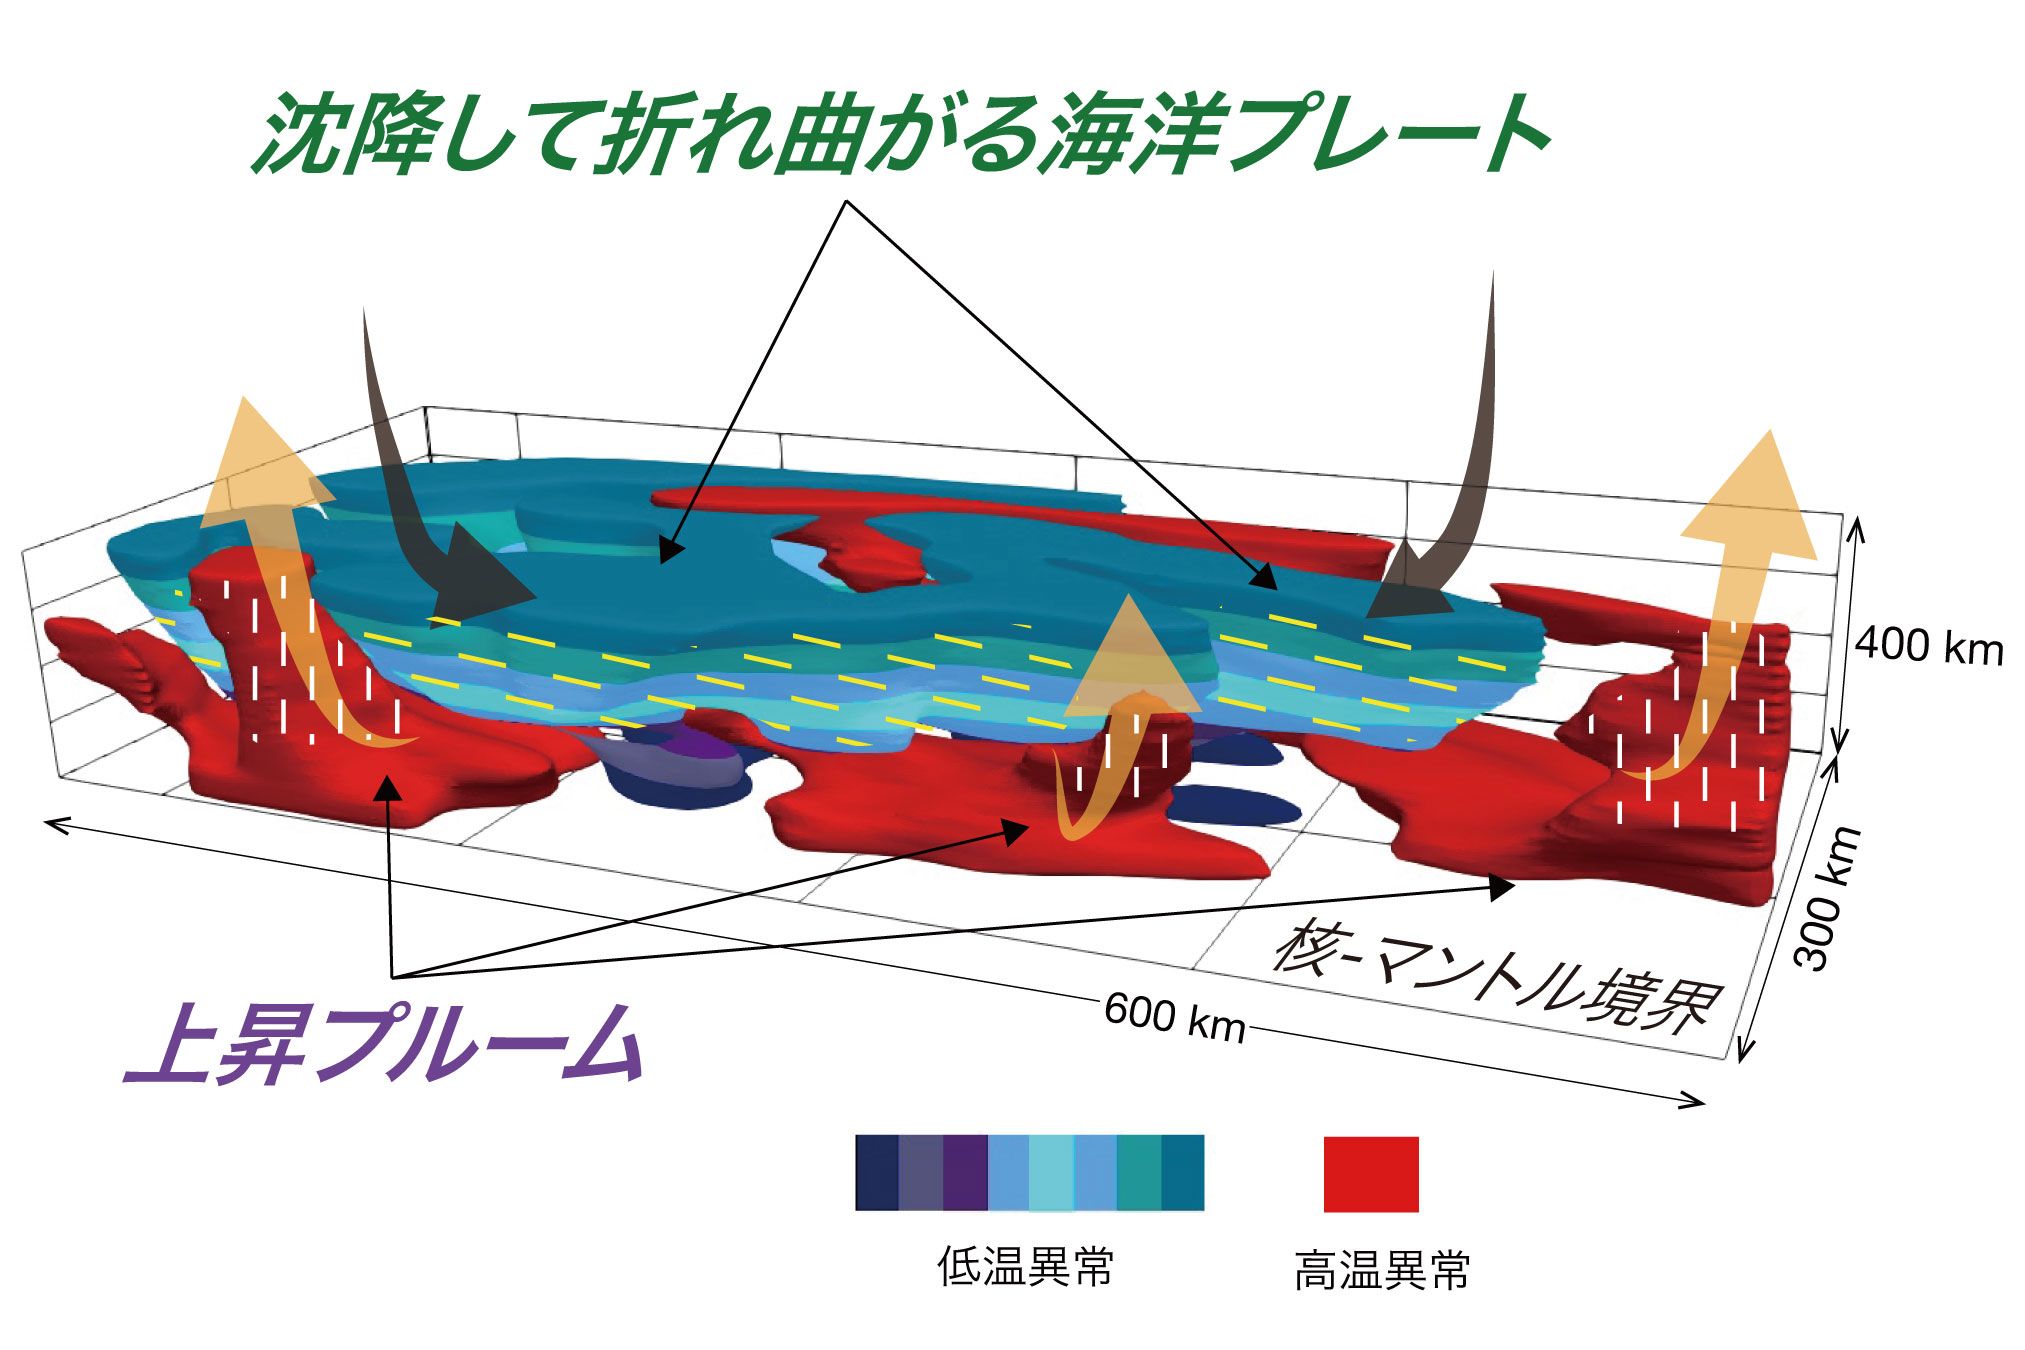
Figure 3: 3D iso-velocity surface of the deepest part of the mantle under the northern Pacific Ocean created based on the structural estimation results. The surfaces comprising each object are isosurfaces of seismic wave velocities. The red boundary is an isosurface with seismic velocity 1% slower than average, corresponding to a temperature increase of about 300K. The blue boundary is an isosurface with seismic velocity 1% faster than average. The color scale of the blue surface indicates the height from the CMB, which can be interpreted as a subducting low-temperature subducting oceanic plate. The red region corresponds to the vertical DC region of the seismic "anisotropic" structure estimate and is considered to be an ascending high-temperature plume.
Journal
-
Journal name Physics of the Earth and Planetary InteriorsTitle of paper Imaging paleoslabs and inferring the Clapeyron slope in D″ beneath the northern Pacific based on high-resolution inversion of seismic waveforms for 3-D transversely isotropic structure.Authors Yuki Suzuki*, Kenji Kawai*, Robert J. Geller*, and Robert J. GellerDOI Number
Terminology
1 Waveform inversion method
Many previous studies on estimating the Earth's interior structure have estimated the interior structure by measuring secondary data such as wave arrival times from observation data and analyzing them using the data. On the other hand, the "waveform inversion method" systematically improves the internal structure model by calculating theoretical seismic waveforms, directly comparing them with observed seismic waveforms, and minimizing the residuals (but with constraints on the resolution to prevent the model from running out of control). The research group has derived the theory for performing waveform inversion and has independently developed related software. ↑up
Note 2 USArray.
A project to install broadband seismometers at intervals of about 70 km from the west coast to the east coast of the U.S. between 2005 and 2015. Expectations for detailed estimation of the Earth's interior structure through the deployment of such an array observation network are growing. ↑up
3 Deepest part of the mantle
A solid region composed of rocks from the bottom of the crust to a depth of approximately 2,900 km (the depth below 2,900 km is the outer core composed of liquid iron alloys, and the depth below 5,150 km is the inner core composed of solid iron). The mantle is divided into the upper mantle and lower mantle at a depth of 660 km, where the main constituent minerals undergo a phase transition. The deepest part of the mantle, approximately 300-400 km above the core-mantle boundary (CMB), is called the D″ region (in this presentation, the deepest part of the mantle is the lowest 400 km of the mantle). The mantle is convective, and the shallowest and deepest parts of the mantle are considered to be convection boundary layers where there is an abrupt temperature change in the vertical direction. Recent studies have also revealed that magnesium perovskite, the main mineral of the lower mantle, undergoes a phase transition to its high-pressure phase, post-perovskite, under the temperature and pressure of the D″ region. Therefore, it is now believed that the lower mantle is composed mainly of perovskite and ferropericlase, while the D″ region is composed of post-perovskite and ferropericlase. ↑up
Note 4: Seismic wave "anisotropic" structure
In an isotropic medium, the propagation velocity of seismic P and S waves may differ from place to place, but at a single point, the propagation velocity does not differ depending on the direction of displacement or propagation direction. However, even at the same location, the propagation velocity may differ depending on the direction of displacement and direction of propagation, which is called "anisotropy". Accurate estimation of the "anisotropic" structure of seismic waves can provide information on the flow and deformation of mantle materials. ↑up
Note 5 Oceanic plates
Oceanic plates, which make up the ocean floor, average about 70-80 km in thickness and are thought to be composed of basaltic oceanic crust, which is partially melted and solidified mantle material, and depleted olivine (harzburgite), which is the remaining melted rock. Oceanic plates are born at oceanic ridges and cool and age as they move away from the ridge. The age of the plate is at most 200 million years, and it is subducted from the oceanic ridge into the Earth's deep interior. Determining the fate of subducting oceanic plates with low temperatures and different chemical compositions is important for understanding the thermochemical evolution of the Earth's mantle. ↑up